library(ezGenomeTracks)
#> Warning: replacing previous import 'AnnotationDbi::select' by 'dplyr::select'
#> when loading 'ezGenomeTracks'
#> ezGenomeTracks v0.0.13
#> Easy and flexible genomic track visualization
#> Use citation('ezGenomeTracks') to see how to cite this package
#> For documentation and examples, visit: https://github.com/zmu/ezGenomeTracks
ezGenomeTracks provides functions to interact with
TxDb objects, map gene ID to symbols and plot genes.
Set up data
library(org.Hs.eg.db)
#> Loading required package: AnnotationDbi
#> Loading required package: stats4
#> Loading required package: BiocGenerics
#>
#> Attaching package: 'BiocGenerics'
#> The following objects are masked from 'package:stats':
#>
#> IQR, mad, sd, var, xtabs
#> The following objects are masked from 'package:base':
#>
#> anyDuplicated, aperm, append, as.data.frame, basename, cbind,
#> colnames, dirname, do.call, duplicated, eval, evalq, Filter, Find,
#> get, grep, grepl, intersect, is.unsorted, lapply, Map, mapply,
#> match, mget, order, paste, pmax, pmax.int, pmin, pmin.int,
#> Position, rank, rbind, Reduce, rownames, sapply, setdiff, sort,
#> table, tapply, union, unique, unsplit, which.max, which.min
#> Loading required package: Biobase
#> Welcome to Bioconductor
#>
#> Vignettes contain introductory material; view with
#> 'browseVignettes()'. To cite Bioconductor, see
#> 'citation("Biobase")', and for packages 'citation("pkgname")'.
#> Loading required package: IRanges
#> Loading required package: S4Vectors
#>
#> Attaching package: 'S4Vectors'
#> The following object is masked from 'package:utils':
#>
#> findMatches
#> The following objects are masked from 'package:base':
#>
#> expand.grid, I, unname
#>
library(TxDb.Hsapiens.UCSC.hg38.knownGene)
#> Loading required package: GenomicFeatures
#> Warning: package 'GenomicFeatures' was built under R version 4.3.3
#> Loading required package: GenomeInfoDb
#> Warning: package 'GenomeInfoDb' was built under R version 4.3.3
#> Loading required package: GenomicRanges
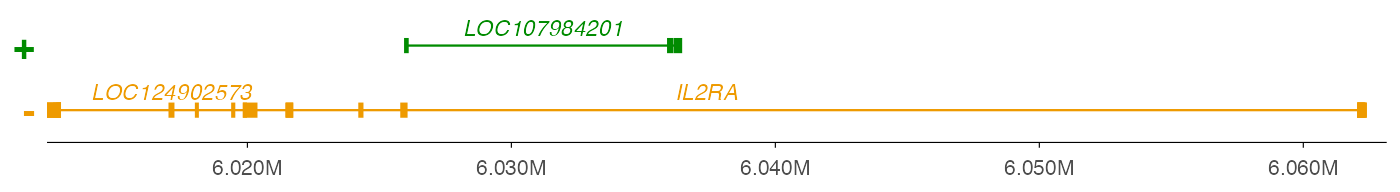
txdb <- TxDb.Hsapiens.UCSC.hg38.knownGenePlot genes with ez_gene
By default, ez_gene detects an org.Hs.eg.db
object in the work space, converts Ensembl gene name to gene symbols,
seperates genes by strand.
geneRegion <- "chr10:6,012,410-6,063,160"

ez_gene(data = txdb, geneRegion)
#> Auto-detected OrgDb: org.Hs.eg.db
#>   2135 genes were dropped because they have exons located on both strands
#>   of the same reference sequence or on more than one reference sequence,
#>   so cannot be represented by a single genomic range.
#>   Use 'single.strand.genes.only=FALSE' to get all the genes in a
#>   GRangesList object, or use suppressMessages() to suppress this message.
#> 'select()' returned 1:1 mapping between keys and columns
#> Warning in data.frame(gene_id = gid, gene_name = gene_symbols[gid], strand =
#> as.character(strand(exons_gr)), : row names were found from a short variable
#> and have been discarded
#> Warning in data.frame(gene_id = gid, gene_name = gene_symbols[gid], strand =
#> as.character(strand(exons_gr)), : row names were found from a short variable
#> and have been discarded
#> Warning in (function (mapping = NULL, data = NULL, stat = "identity", position = "identity", : Ignoring unknown parameters: `arrow_length`, `arrow_type`, `exon_colour`,
#> `intron_colour`, and `clip_to_region`
#> Warning in (function (mapping = NULL, data = NULL, stat = "identity", position
#> = "identity", : Ignoring unknown aesthetics: fill
#> Scale for colour is already present.
#> Adding another scale for colour, which will replace the existing scale.
#> Warning: Vectorized input to `element_text()` is not officially supported.
#> ℹ Results may be unexpected or may change in future versions of ggplot2.
Advanced usage
Extracting gene information from a TxDb object can be
slow. Alternatively, you can use functions provided in the package to
extract gene information from a given region, and use the output data
frame for plotting.
geneRegion <- "chr10:6,012,410-6,063,160"
geneDf <- ezGenomeTracks:::extract_txdb_data(
  txdb,
  region_gr = ezGenomeTracks::parse_region(geneRegion)
)
#> Auto-detected OrgDb: org.Hs.eg.db
#>   2135 genes were dropped because they have exons located on both strands
#>   of the same reference sequence or on more than one reference sequence,
#>   so cannot be represented by a single genomic range.
#>   Use 'single.strand.genes.only=FALSE' to get all the genes in a
#>   GRangesList object, or use suppressMessages() to suppress this message.
#> 'select()' returned 1:1 mapping between keys and columns
#> Warning in data.frame(gene_id = gid, gene_name = gene_symbols[gid], strand =
#> as.character(strand(exons_gr)), : row names were found from a short variable
#> and have been discarded
#> Warning in data.frame(gene_id = gid, gene_name = gene_symbols[gid], strand =
#> as.character(strand(exons_gr)), : row names were found from a short variable
#> and have been discarded

ez_gene(data = geneDf, geneRegion)
#> Warning in (function (mapping = NULL, data = NULL, stat = "identity", position = "identity", : Ignoring unknown parameters: `arrow_length`, `arrow_type`, `exon_colour`,
#> `intron_colour`, and `clip_to_region`
#> Warning in (function (mapping = NULL, data = NULL, stat = "identity", position
#> = "identity", : Ignoring unknown aesthetics: fill
#> Scale for colour is already present.
#> Adding another scale for colour, which will replace the existing scale.
#> Warning: Vectorized input to `element_text()` is not officially supported.
#> ℹ Results may be unexpected or may change in future versions of ggplot2.