Minimal, ggplot2-based genome browser tracks for R. Provides geoms (geom_*) and easy wrappers (ez_*) to plot common genomics data (coverage, genes, features/peaks, interactions/arcs, Hi-C, Manhattan) and compose them vertically with a shared genomic x-axis via vstack_plot().
![]()
![]()
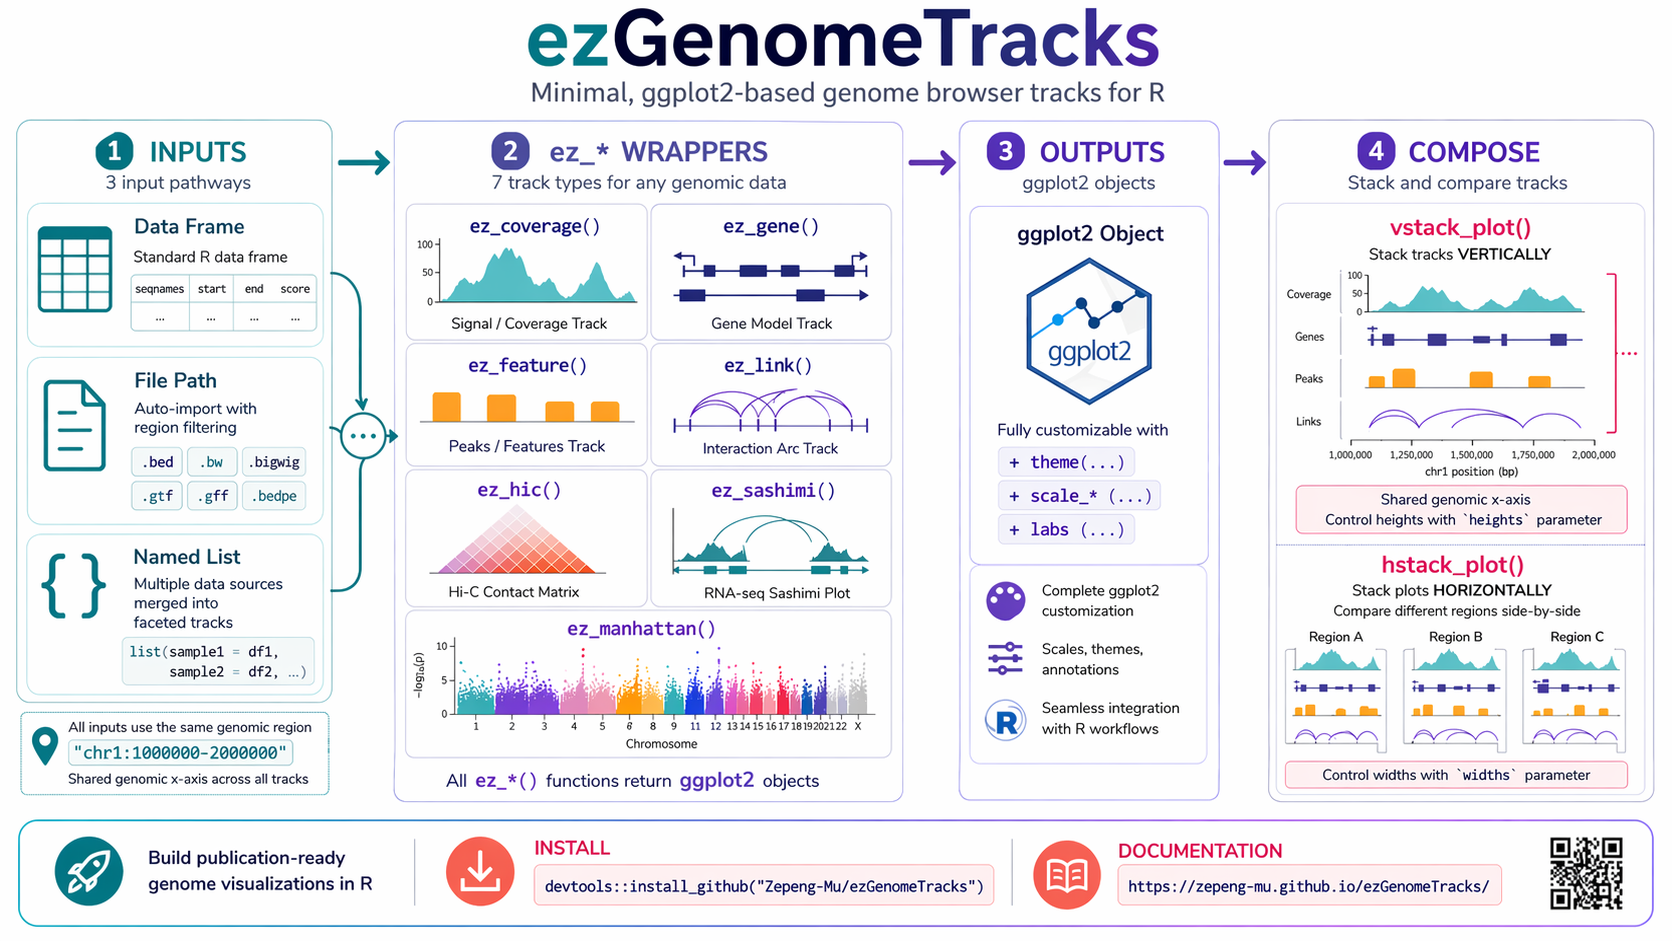
Infographic generated with GPT-image-2
[!NOTE]
ezGenomeTracksis my experiment with Vibe Coding. I mostly use Github Copilot Business. I have also tried Cursor, TRAE and Windsurf.
[!NOTE]
ezGenomeTracksis in early development, many functionalities may be missing or incomplete. Feedback and contributions are welcome!
Installation
Install ezGenomeTracks from GitHub using pak, which automatically handles Bioconductor dependencies:
# install.packages("pak")
pak::pak("Zepeng-Mu/ezGenomeTracks")
Core Concepts
- Region specification: always parse a string like
"chr1:100000-101000". - Wrappers
ez_*()accept data frames, file paths, or lists and apply the proper geom + theme. - All tracks must share identical x-limits (same region) for composition.
- Standard columns follow GRanges style:
seqnames,start,end,strand; plus type-specific columns (score, gene annotations, interaction endpoints).
Quick Start
library(ezGenomeTracks)
region <- "chr1:100000-101000"
Coverage / Signal Track
A numeric score over intervals.
cov_df <- tibble::tibble(
  seqnames = "chr1",
  start = seq(100000, 100990, by = 10),
  end = start + 9,
  score = rnorm(length(start), 10, 2)
)
track_cov <- ez_coverage(cov_df, region = region)Feature / Peak Track
Intervals with optional scores (height / color).
features_df <- tibble::tibble(
  seqnames = "chr1",
  start = c(100120, 100300),
  end   = c(100180, 100360),
  score = c(12, 8)
)
track_feat <- ez_feature(features_df, region = region)
Interaction / Arc Track
Pairs of genomic intervals (same or different chromosomes) drawn as arcs.
interactions_df <- tibble::tibble(
  chr1 = "chr1", start1 = 100120, end1 = 100160,
  chr2 = "chr1", start2 = 100300, end2 = 100340,
  score = 5
)
track_arc <- ez_arc(interactions_df, region = region)
Manhattan Track
Association results: point positions + score (e.g. -log10(p)).
manhattan_df <- tibble::tibble(
  seqnames = rep("chr1", 50),
  start = seq(100000, 100000 + 49*200, by = 200),
  end = start + 1,
  score = rexp(50, rate = 0.3)
)
track_manh <- ez_manhattan(manhattan_df, region = region)
Hi-C / Contact Matrix Track
Binned pairwise contacts rendered as a triangular heatmap.
# Minimal synthetic example (x/y bins with a value)
hic_df <- tidyr::expand_grid(
  bin1 = seq(100000, 100000 + 4*200, by = 200),
  bin2 = seq(100000, 100000 + 4*200, by = 200)
) |> dplyr::filter(bin2 >= bin1) |> dplyr::mutate(
  score = runif(dplyr::n(), 0, 1),
  seqnames = "chr1"
) |> dplyr::rename(start1 = bin1, start2 = bin2)
track_hic <- ez_hic(hic_df, region = region)
Composing Multiple Tracks
Stack tracks vertically with synchronized genomic x-axis.
combined <- vstack_plot(
  list(
    coverage = track_cov,
    genes = track_gene,
    peaks = track_feat,
    arcs = track_arc
  ),
  region = region,
  heights = c(2, 1, 1, 1)
)
combined
Input Flexibility
Each ez_* can take: - Data frame (as above) - File path (e.g. BED, bedGraph, GTF) – internally imported with region filtering - Named list of objects (merged into a single track)
Customization
Control theme variants (ez_theme(), track-specific themes), y-axis visibility (none, simple, full), colors (standard ggplot2 scales or custom palettes), and relative track heights in vstack_plot().
Data Conventions Summary
- Coordinates:
seqnames,start,end, optionalstrand(factor with levelsminus,plus,Unknown). - Signal/coverage:
score. - Genes:
gene_id,gene_name(optional),transcript_id,type(gene/exon). - Features/peaks: intervals + optional
score. - Interactions/arcs:
chr1,start1,end1,chr2,start2,end2, optionalscore. - Hi-C: binned pairwise positions (package converts to triangle), numeric
score.
Tips / Pitfalls
- Always use one region string for all tracks to align x-limits.
- Ensure strand factor levels if using gene track.
- Large files: region filtering reduces import time.
- Keep column names exact; wrappers rely on them.